Step-by-Step Solutions for Z-Transform Problems Using MATLAB

The Z-transform is a powerful mathematical tool widely used in digital signal processing, control systems, and many other fields of engineering and applied mathematics. It provides a bridge between discrete-time signals and their frequency-domain representations. Mastering Z-transform techniques can often feel daunting, but tools like MATLAB simplify the process by offering prebuilt functions and visualization capabilities. If you’re struggling with Z-transform problems, this blog offers a comprehensive guide to solving them step by step using MATLAB. For those who need specialized assistance, services like Z-Transform Assignment Help can provide targeted support to excel in your studies.

What is the Z-Transform?
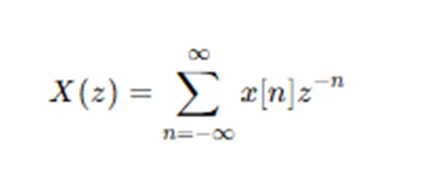
Before diving into MATLAB, it’s essential to understand the Z-transform conceptually. The Z-transform converts a discrete-time signal into a complex frequency-domain representation :

where z is a complex variable. This transformation helps analyze and design discrete-time systems by providing insights into their stability and frequency response.
Common Applications of the Z-Transform
- Stability Analysis: Evaluate the stability of discrete-time systems.
- Filter Design: Analyze and implement digital filters.
- Signal Processing: Study and manipulate signals in the z-domain.
- System Analysis: Determine system behavior using poles and zeros.
Why Use MATLAB for Z-Transform Problems?
MATLAB simplifies complex calculations by offering built-in functions for symbolic and numerical computations. Additionally, its graphical capabilities make it easy to visualize poles, zeros, and frequency responses. Whether you’re seeking MATLAB assignment help or working independently, this software is an indispensable tool for engineers and students.
Step-by-Step Guide to Solving Z-Transform Problems Using MATLAB
Step 1: Representing the Signal
The first step is to represent your discrete-time signal in MATLAB. Depending on whether your signal is symbolic or numerical, you can use different MATLAB approaches.
Example 1: Symbolic Signal Representation
If , you can define it symbolically as follows:
syms n z
x = 2^n;
This allows you to manipulate the signal using MATLAB’s symbolic toolbox.
Example 2: Numerical Signal Representation
For numerical signals, define the sequence directly:
x = [1, 2, 4, 8]; % Example sequence
n = 0:length(x)-1;
Step 2: Compute the Z-Transform
To find the Z-transform of a signal, MATLAB provides the ztrans function for symbolic calculations.
Example: Z-Transform of a Symbolic Signal
Using the signal defined above:
X = ztrans(x, n, z);
disp(X);
This will compute and display the Z-transform of the sequence .
Numerical Approximation of Z-Transform
For numerical signals, you might need to compute the Z-transform manually using the summation formula. However, most applications require symbolic computation.
Step 3: Inverse Z-Transform
To revert from the Z-domain to the time domain, use the iztrans function:
x_inverse = iztrans(X, z, n);
disp(x_inverse);
This helps validate your results by confirming that the original sequence is retrieved.
Step 4: Visualizing Poles and Zeros
Poles and zeros are crucial for understanding system behavior. MATLAB’s pzmap function can be used for visualization.
Example: Pole-Zero Map
Suppose is represented as a transfer function:
num = [1 -2 3]; % Coefficients of the numerator
den = [1 5 6]; % Coefficients of the denominator
sys = tf(num, den, -1); % Transfer function in discrete time
pzmap(sys);
This command generates a pole-zero plot to analyze system stability.
Step 5: Partial Fraction Decomposition
Partial fraction decomposition simplifies complex rational expressions in the Z-domain. Use the residuez function for this purpose:
[r, p, k] = residuez(num, den);
Here:
- r contains the residues,
- p contains the poles,
- k contains the direct term.
This decomposition is particularly useful when performing inverse Z-transforms manually.
Advanced Techniques and Applications
Stability Analysis Using MATLAB
Stability of a discrete-time system depends on the location of its poles. Poles must lie within the unit circle in the z-plane for the system to be stable.
pzmap(sys);
Inspect the plot to ensure all poles are inside the unit circle.
Frequency Response Analysis
The frequency response of a system can be determined using the freqz function:
[h, w] = freqz(num, den, 'half');
plot(w, abs(h));
This command plots the magnitude response, providing insights into the system’s behavior at different frequencies.
Filtering with Z-Transforms
Design digital filters directly in MATLAB and analyze their Z-transform properties.
Example: Low-Pass Filter Design
[b, a] = butter(3, 0.5, 'low'); % 3rd-order Butterworth filter
freqz(b, a);
Practical Examples
Example 1: Z-Transform of a Unit Step Signal
A unit step signal is defined as:
Example 2: System Analysis
Analyze a discrete-time system with the transfer function:
num = [1 -0.5];
den = [1 0.25 -0.125];
sys = tf(num, den, -1);
% Plot Pole-Zero Map
pzmap(sys);
% Plot Frequency Response
freqz(num, den);
The pole-zero map and frequency response provide insights into system stability and performance.
Common Pitfalls and Troubleshooting
Numerical Precision Issues
When working with numerical data, MATLAB might introduce small rounding errors. Use vpa for variable-precision arithmetic in symbolic calculations.
vpa(X, 5); % Display X with 5 significant digits
Misinterpretation of Results
Ensure proper interpretation of poles and zeros. For example:
- Poles outside the unit circle indicate instability.
- Zeros near the unit circle may affect system frequency response significantly.
Complex Signals
For signals with complex components, use real and imag functions to analyze their properties:
real_part = real(x);
imag_part = imag(x);
Conclusion
Solving Z-transform problems using MATLAB is a systematic process that involves signal representation, computation of Z-transforms, and analysis of system properties through tools like pole-zero maps and frequency response plots. By following the steps outlined in this guide, you can tackle a wide range of problems effectively.
If you need further assistance with your MATLAB tasks, consider reaching out for MATLAB assignment help to ensure success in your academic and professional projects. Combining theoretical understanding with practical MATLAB skills will empower you to master Z-transform applications and excel in your field.